Tell us about the job
Takes about a minute. No obligation.
Homes in Pitkin County, CO run heat in every month of the year. The burner and ignition system on a boiler here cycle through every month without a full off-season to rest. A contractor diagnosing a repair in Aspen or Snowmass will check those parts before anything else, because accumulated cycling wear is the likeliest source of failure. Heat exchangers carry the same load and get the same early attention on any quote.
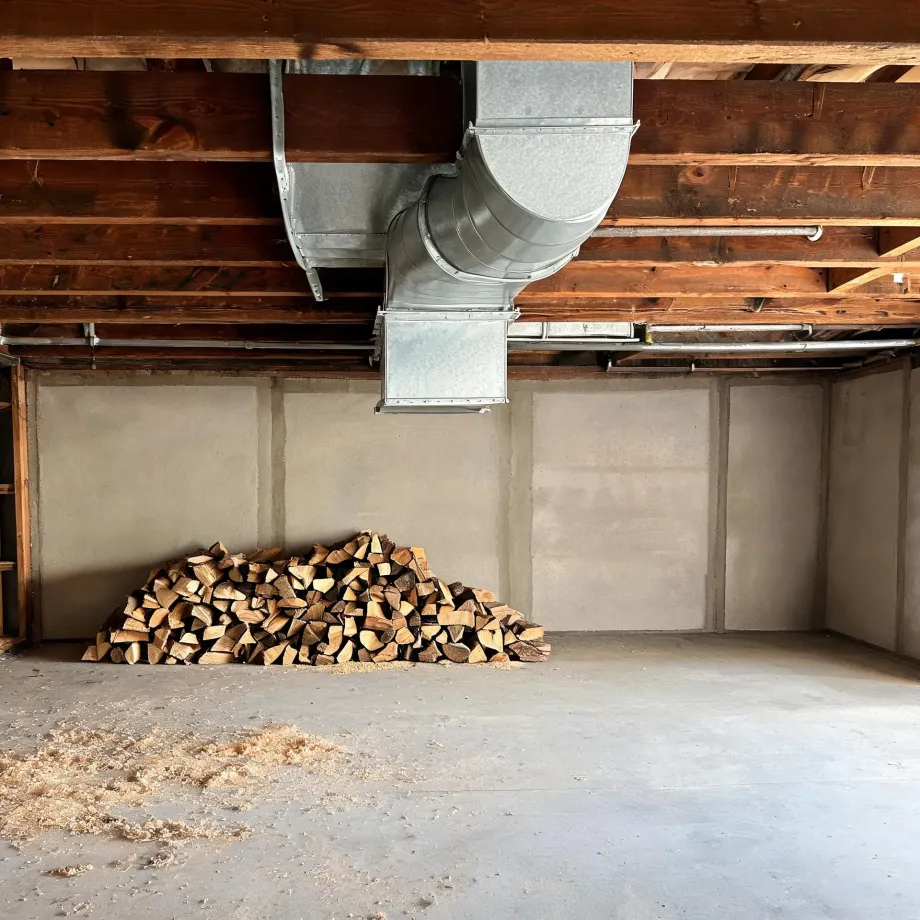
Piping that was laid when a house was first built tends to stay in the walls long after the boiler it served has been swapped out. Half the homes in Pitkin County, Colorado were built in 1985 or earlier (2020-2024 ACS 5-year). That matters for repair work because a contractor opening a failed boiler here often finds that the distribution side, the pipes, the zone valves, the expansion tank, reflects decisions made for a different system. A part that tests fine on the replacement unit can still underperform if the loop it feeds was never rebalanced for it. The repair scope, and what it costs, follows from what the opened system and its distribution circuit actually contain.
The Parts of a Boiler a Contractor Checks First
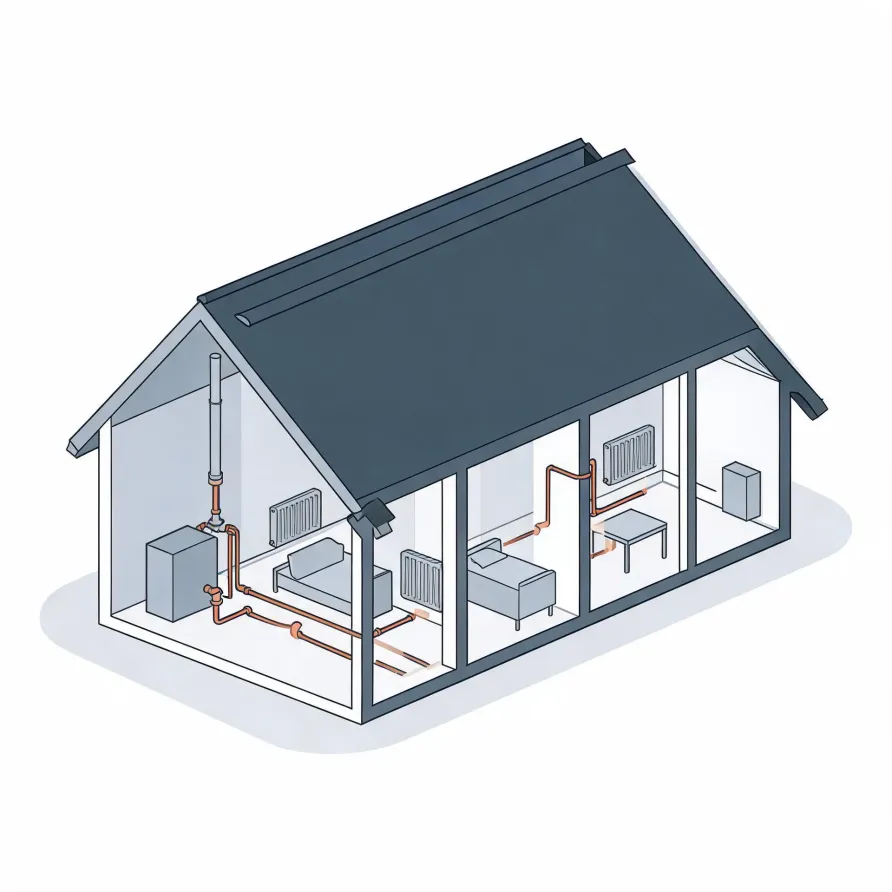
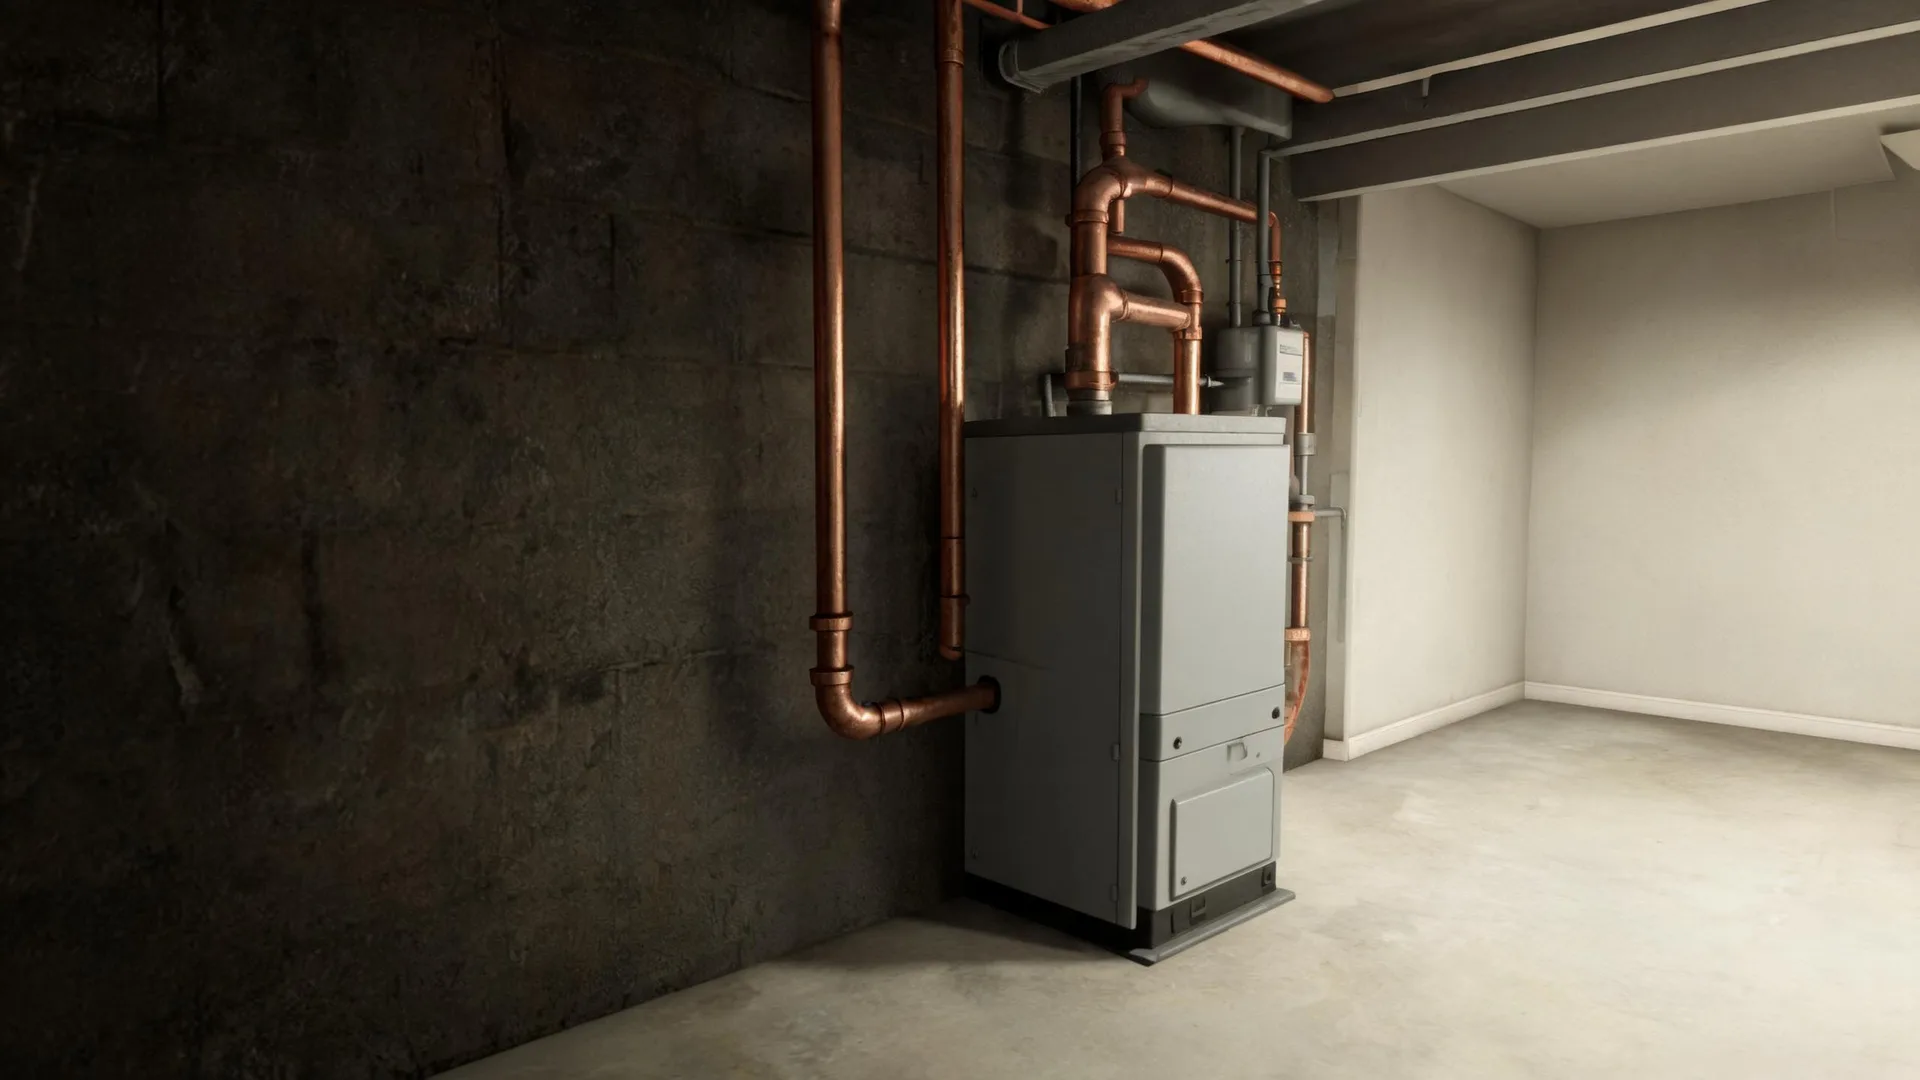
The boiler itself sits in the basement or a mechanical room and is the piece a contractor looks at before anything else. It houses the burner and the heat exchanger, and when either one is failing, the system either stops producing heat or produces it dangerously. The circulator pump mounts directly on the boiler and is the next suspect when heat reaches some rooms but not others.
Radiators and baseboard units sit throughout the living space and are the places where a homeowner first notices something is wrong. Thermostatic radiator valves, zone valves, and the expansion tank all tie the system together, and each one can be the source of pressure loss, uneven heat, or a boiler that short-cycles and shuts down.
The drawing shows the general layout of a boiler system, and a licensed contractor determines which components and conditions apply to your specific home.
Get matched in Pitkin CountyPitkin County, by the numbers
84 severe weather events were recorded in Pitkin County, Colorado between 2015 and 2024.
NOAA National Centers for Environmental Information, Storm Events Database, bulk CSV export, events 2015-01-01 through 2024-12-31.Half the homes in Pitkin County, Colorado were built in 1985 or earlier (2020-2024 ACS 5-year).
U.S. Census Bureau, 2020-2024 American Community Survey 5-Year EstimatesPitkin County, Colorado holds 13,412 housing units (2020-2024 ACS 5-year).
U.S. Census Bureau, 2020-2024 American Community Survey 5-Year EstimatesOwners occupy 62.8% of the occupied homes in Pitkin County, Colorado (2020-2024 ACS 5-year).
U.S. Census Bureau, 2020-2024 American Community Survey 5-Year EstimatesSevere Weather Events in Pitkin County
Boilers work hardest when outside conditions demand the most from them, and that demand is shaped by local weather patterns. Knowing what Pitkin County's climate has actually thrown at heating systems over the years puts repair and maintenance decisions in the right context.
84 severe weather events, 2015–2024. Source: NOAA National Centers for Environmental Information, Storm Events Database.