Tell us about the job
Takes about a minute. No obligation.
A contractor sizing a boiler for a Custer County home has to treat the load as nearly continuous, because the burner and ignition system cycle through almost the entire calendar year. Homes in Custer County, CO run heat about eleven months a year, from August through June. That kind of sustained demand falls hardest on the heat exchanger and the ignition assembly, the components that absorb each start and stop. A system installed without a proper load calculation for this address will run oversized or undersized against that demand, and either error accelerates wear on the parts that cannot rest.
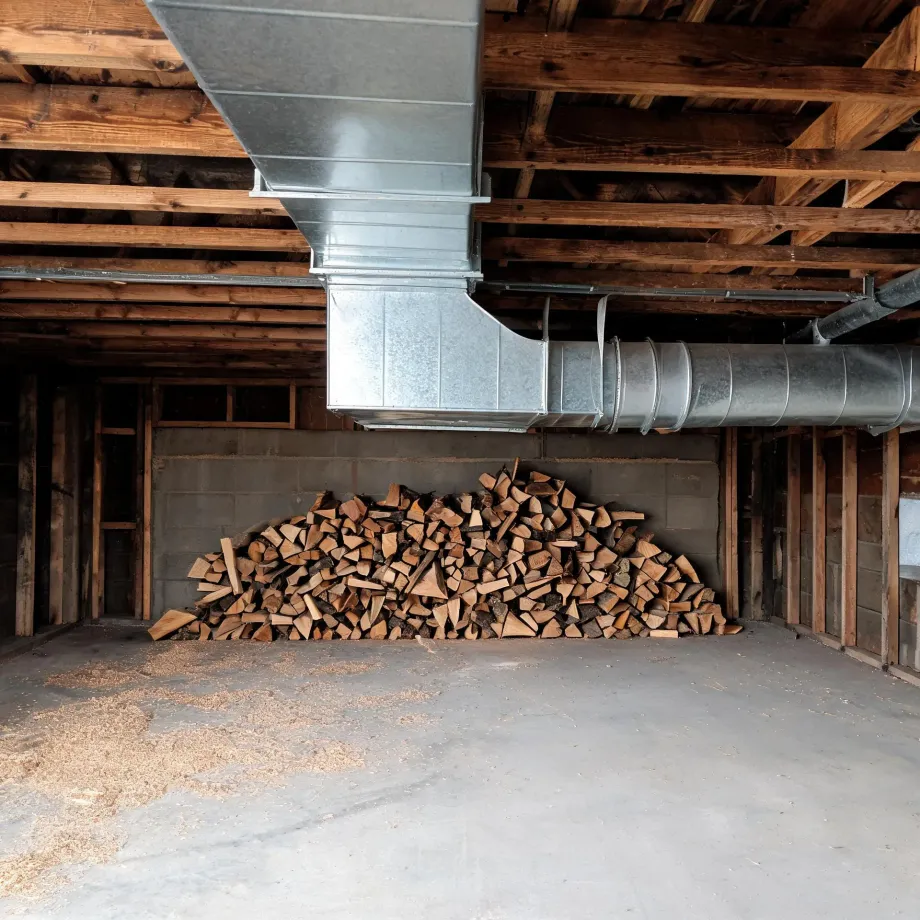
Ductwork sized for an old system is what a contractor opens up in a lot of Custer County houses. Half the homes in Custer County, Colorado were built in 1992 or earlier (2020-2024 ACS 5-year). When the boiler in a house changes, what already runs through the walls either fits the load the new unit puts on it or it does not, and in stock built around equipment that has long since been replaced, that gap shows up often enough to price before anything else. The electrical side follows the same logic: a service panel put in for one load may not serve a different one without work. What carries the heat through the house is the variable that decides how a boiler installation goes here.
What Gets Installed With a New Boiler
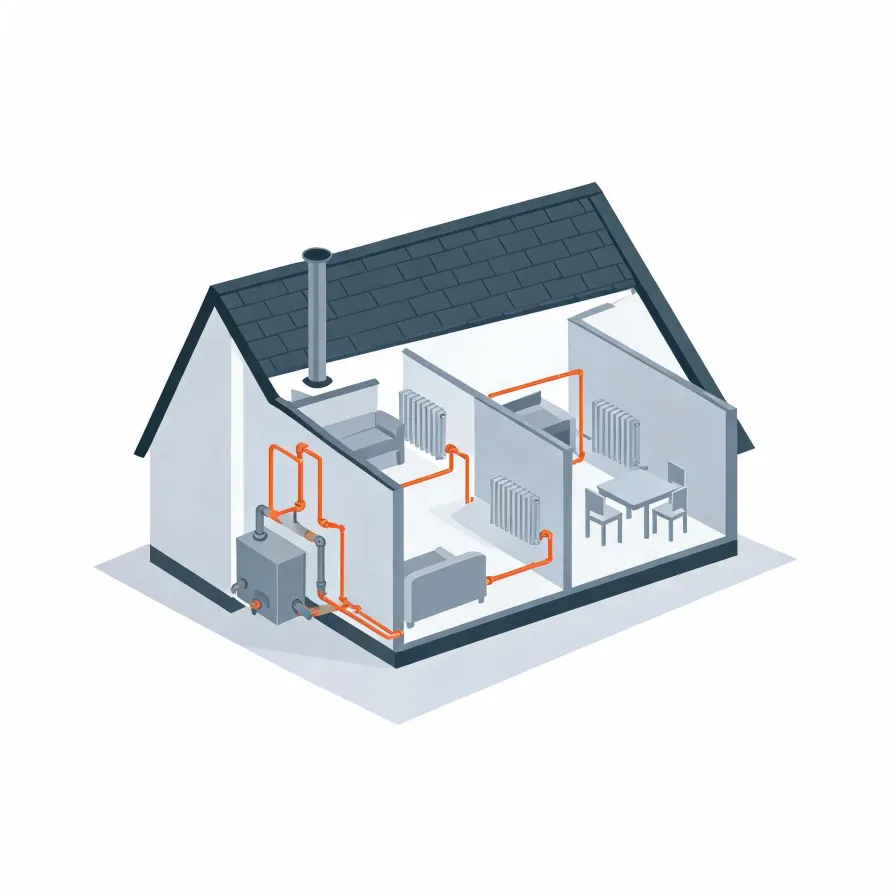
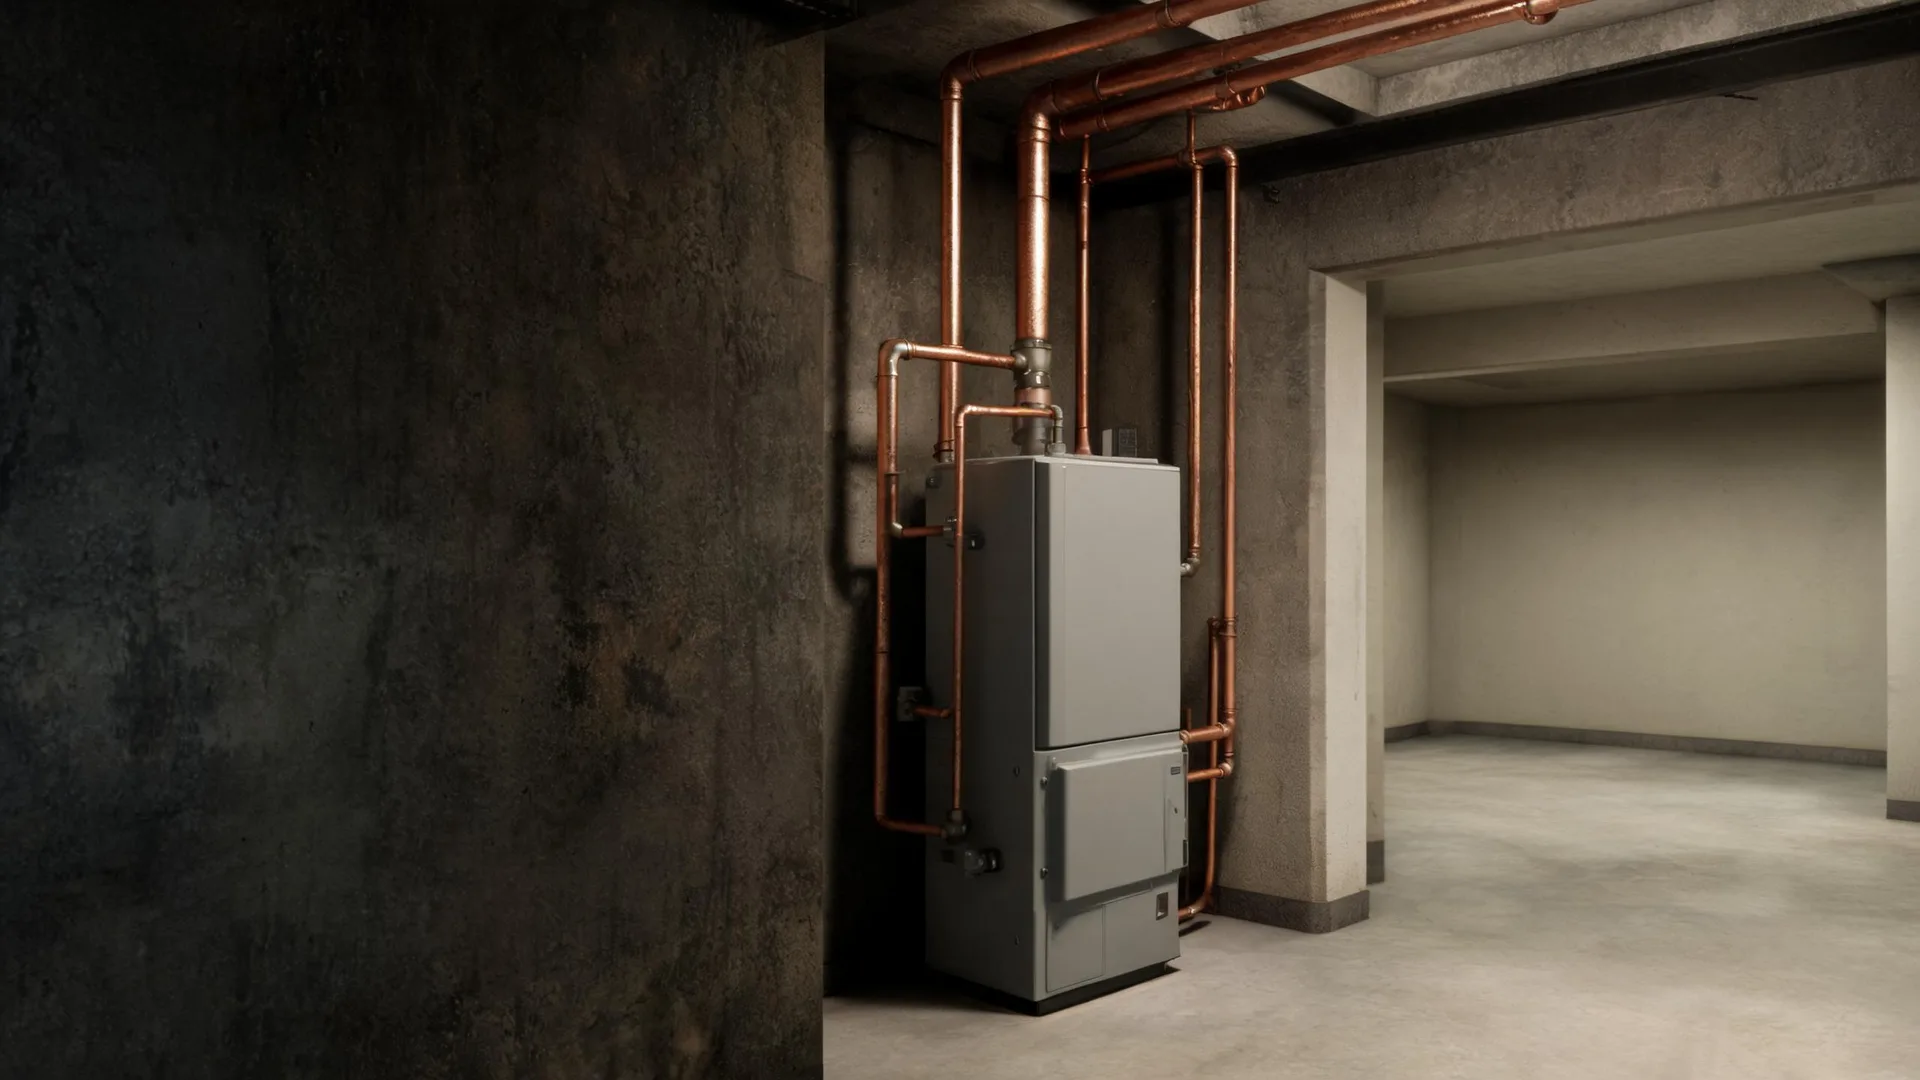
The boiler itself sits in a mechanical room, basement, or utility closet and is the unit that heats the water the system runs on. A contractor installs the heat exchanger inside it, the burner assembly, and the pressure and temperature controls that govern how the unit operates.
Radiators or radiant floor loops sit in the living spaces and are the surfaces through which heat moves into each room. A circulator pump, typically mounted close to the boiler, drives the water through the pipes that connect everything, and an expansion tank nearby absorbs pressure changes as the water heats and cools.
The drawing shows a representative layout, and a licensed contractor determines exactly which components and configurations apply to your home.
Get matched in Custer CountyCuster County, by the numbers
427 severe weather events were recorded in Custer County, Colorado between 2015 and 2024.
NOAA National Centers for Environmental Information, Storm Events Database, bulk CSV export, events 2015-01-01 through 2024-12-31.Half the homes in Custer County, Colorado were built in 1992 or earlier (2020-2024 ACS 5-year).
U.S. Census Bureau, 2020-2024 American Community Survey 5-Year EstimatesCuster County, Colorado holds 4,631 housing units (2020-2024 ACS 5-year).
U.S. Census Bureau, 2020-2024 American Community Survey 5-Year EstimatesOwners occupy 85.3% of the occupied homes in Custer County, Colorado (2020-2024 ACS 5-year).
U.S. Census Bureau, 2020-2024 American Community Survey 5-Year EstimatesSevere Weather Events in Custer County
Boiler systems work harder and wear faster when local conditions push temperatures to extremes or send storms through in quick succession. How much weather a county absorbs over time is a real factor in how a boiler is sized, specified, and installed.
427 severe weather events, 2015–2024. Source: NOAA National Centers for Environmental Information, Storm Events Database.