Tell us about the job
Takes about a minute. No obligation.
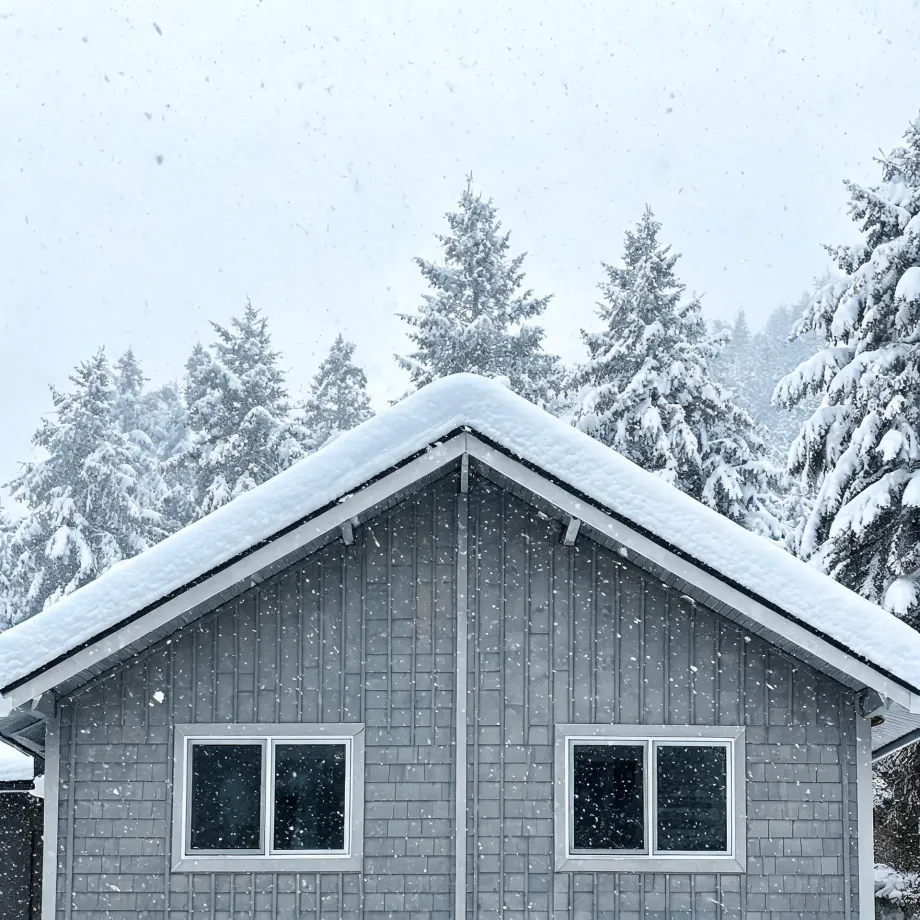
Sizing a boiler for a Costilla County home is not a step a contractor can estimate loosely. Homes in Costilla County, CO run heat about ten months a year, from September through June. A burner and heat exchanger that cycle through a season that long accumulate wear on every start, every shutdown, and every hour at operating temperature. An undersized unit runs longer per call; an oversized unit short-cycles, stressing the ignition system and leaving rooms cold on the hardest mornings. A contractor quoting this work has to build the load calculation from the house itself, including insulation, window area, and infiltration, before anything goes on a truck.
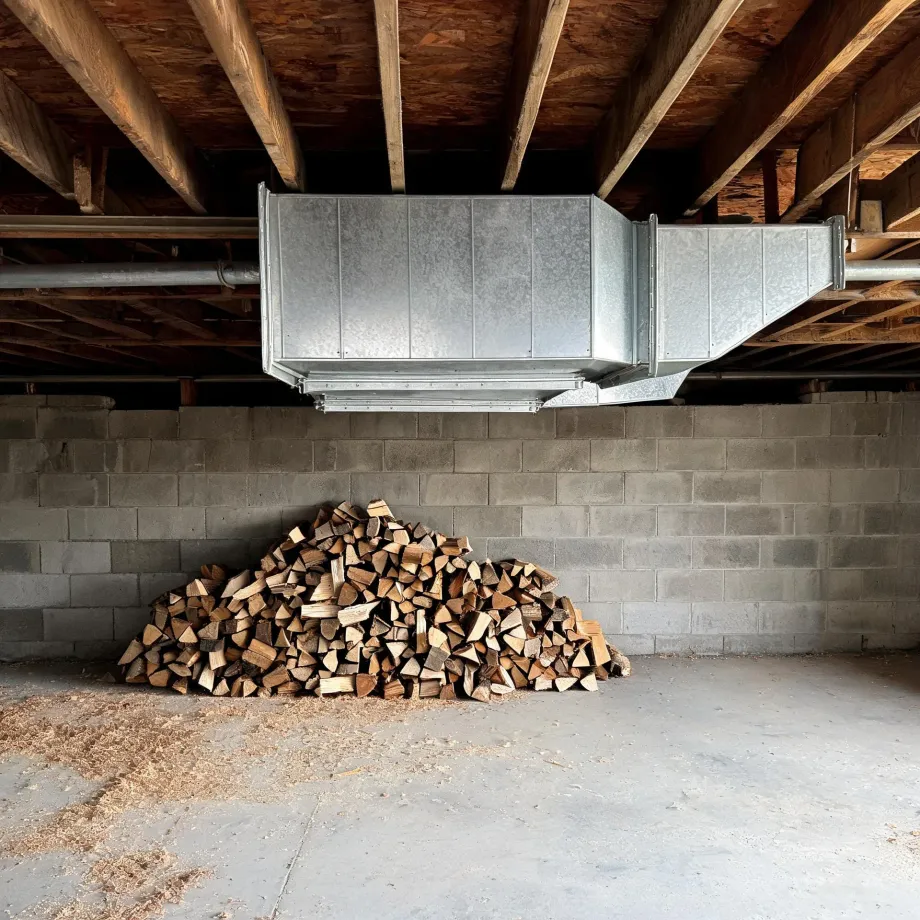
Ductwork routed for an older system and electrical service sized for a lighter load are what a contractor finds behind the walls in much of Costilla County. Half the homes in Costilla County, Colorado were built in 1985 or earlier (2020-2024 ACS 5-year). That history means a boiler installation quote cannot be written from the street. A contractor has to open access panels, trace the existing runs, and confirm what the service will carry before the equipment choice matters at all.
What Gets Installed With a New Boiler
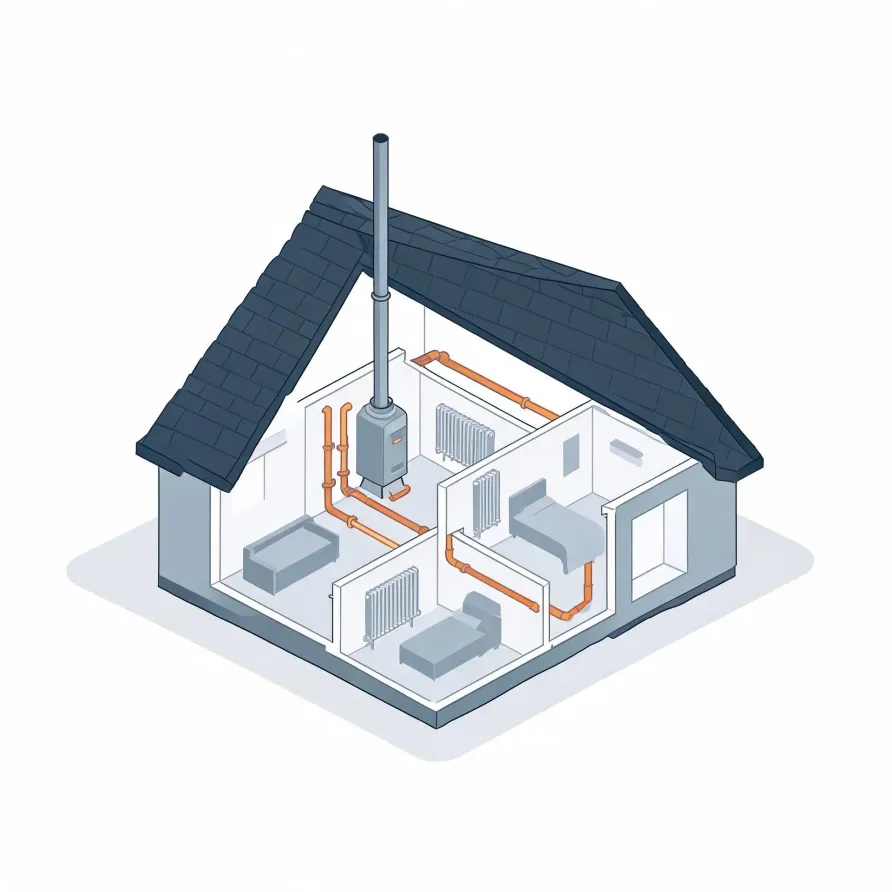
The boiler itself sits in a mechanical room, basement, or utility closet and is the unit a homeowner is most likely to see. It heats water that a contractor then routes through the house. Alongside it, the expansion tank mounts directly to the system's plumbing and absorbs pressure changes as water heats and cools.
Radiators or radiant floor loops sit at the far ends of the system, room by room, and are where the heat actually reaches the living space. The circulator pump, mounted near the boiler, moves water through those loops on demand. A contractor also installs the thermostat, aquastat, and any zone valves that control which areas of the house call for heat and when.
The drawing shows a typical layout, and a licensed contractor determines exactly which components apply to your house and how they connect.
Get matched in Costilla CountyCostilla County, by the numbers
309 severe weather events were recorded in Costilla County, Colorado between 2015 and 2024.
NOAA National Centers for Environmental Information, Storm Events Database, bulk CSV export, events 2015-01-01 through 2024-12-31.Half the homes in Costilla County, Colorado were built in 1985 or earlier (2020-2024 ACS 5-year).
U.S. Census Bureau, 2020-2024 American Community Survey 5-Year EstimatesCostilla County, Colorado holds 2,433 housing units (2020-2024 ACS 5-year).
U.S. Census Bureau, 2020-2024 American Community Survey 5-Year EstimatesOwners occupy 79.0% of the occupied homes in Costilla County, Colorado (2020-2024 ACS 5-year).
U.S. Census Bureau, 2020-2024 American Community Survey 5-Year EstimatesSevere Weather Events in Costilla County
Costilla County's climate puts real demands on heating equipment, and those demands are shaped by what the weather actually does here year over year. A boiler sized and installed for local conditions holds up differently than one specified without that picture in mind.
309 severe weather events, 2015–2024. Source: NOAA National Centers for Environmental Information, Storm Events Database.