Tell us about the job
Takes about a minute. No obligation.
Burners and ignition assemblies in this area cycle hard, and the parts that take the most stress are the ones a contractor checks first on a repair call. Homes in La Plata County, CO run heat about ten months a year, from September through June. A heat exchanger carrying that kind of continuous seasonal load develops fatigue cracks and scaling that a visual inspection can miss if the contractor is not looking in the right places. Flame sensors, gas valves, and circulator pumps all show wear patterns that reflect how much the system has actually been asked to do, not how old it looks on paper.
Boilers in La Plata County's older housing have usually been through at least one full equipment swap, which means the unit a contractor opens today is sitting in a mechanical room that was designed around something earlier. Half the homes in La Plata County, Colorado were built in 1993 or earlier (2020-2024 ACS 5-year). That gap matters when parts are on order: heat exchangers, aquastats, and zone valves for systems of this generation can be harder to source than the repair itself, and a contractor who has not confirmed availability before quoting is pricing a best case. The age of the building is not what complicates these jobs. It is what the opened system actually contains.
The Parts of a Boiler a Contractor Checks First
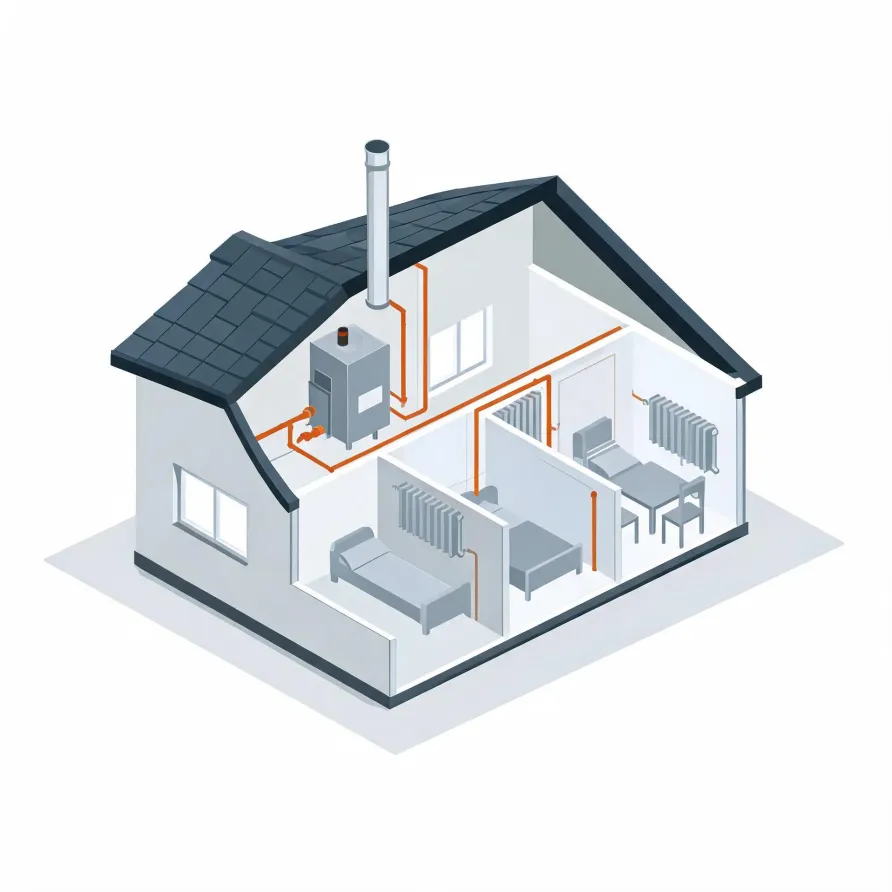
The boiler itself sits in the basement or mechanical room and is the first place a contractor looks when something goes wrong. It heats water and pushes it through the system. The burner assembly and heat exchanger live inside it, and a failure in either one shows up fast as no heat or uneven heat.
Radiators or baseboard units sit in the living spaces and are where heat actually enters the rooms. Connecting them to the boiler are supply and return pipes, along with circulator pumps that move the water and zone valves that control where it goes. A contractor checks these components when the boiler runs but a room stays cold.
The drawing shows a typical layout, and a licensed contractor assesses which parts apply and what the condition of each one is in your specific home.
Get matched in La Plata CountyLa Plata County, by the numbers
167 severe weather events were recorded in La Plata County, Colorado between 2015 and 2024.
NOAA National Centers for Environmental Information, Storm Events Database, bulk CSV export, events 2015-01-01 through 2024-12-31.Half the homes in La Plata County, Colorado were built in 1993 or earlier (2020-2024 ACS 5-year).
U.S. Census Bureau, 2020-2024 American Community Survey 5-Year EstimatesLa Plata County, Colorado holds 28,990 housing units (2020-2024 ACS 5-year).
U.S. Census Bureau, 2020-2024 American Community Survey 5-Year EstimatesOwners occupy 70.9% of the occupied homes in La Plata County, Colorado (2020-2024 ACS 5-year).
U.S. Census Bureau, 2020-2024 American Community Survey 5-Year EstimatesSevere Weather Events in La Plata County
La Plata County's climate puts real stress on boiler systems. Each weather event recorded here represents a period when heating equipment was working harder, or was exposed to conditions that accelerate wear.
167 severe weather events, 2015–2024. Source: NOAA National Centers for Environmental Information, Storm Events Database.